The third-order intercept point (IP3) is an important indicator to measure the linearity of the communication system. It reflects the magnitude of the intermodulation distortion when the system is interfered by strong signals. When the IP3 of the system is high, it is difficult to accurately test the IP3, because various factors in the test environment (such as the isolation, linearity and matching of the test accessories) are likely to affect the high IP3 test. The following is a brief introduction to the IP3 test principle and a detailed analysis of the high IP3 test method.
1 IP3 test principleIn wireless communication devices, the nonlinearity of devices (such as amplifiers, mixers, modems, etc.) typically causes simultaneous intrusion of two or more strong interfering signals to intermodulate and generate new frequency components. This phenomenon is called intermodulation. Intermodulation interference not only reduces the power of the wanted signal, causes signal distortion, reduces system selectivity, but also degrades the performance of adjacent channels. Therefore, intermodulation performance is a system common inspection indicator, usually expressed by IP3.
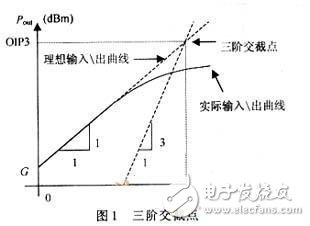
IP3 is the intersection of the output signal of the working frequency signal in the ideal linear system and the amplitude of the third-order intermodulation component, which is a fixed point. As shown in Figure 1 [1]. This point is the virtual intersection point, which cannot be directly measured in the actual system, but can be calculated by the relevant measured values. The principle of the IP3 calculation formula will be briefly introduced below.
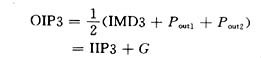
Although there may be two or more strong signals entering the system, for the convenience of testing, it is assumed that only two strong equal-amplitude tone signals invade the system. If a power series is used to represent the nonlinear action of the device, and the frequencies of the tone signals are assumed to be f1 and f2, respectively, it is not difficult to introduce the frequency of the third-order intermodulation component as (2f1-f2) or (2f2-f1). . The calculation formula for IP3 (IIP3, OIP3) is [2]:
Where: IIP3 is the input IP3, which is the abscissa of IP3;
OIP3 is the output IP3, which is the ordinate of IP3;
Pin is the input power level of the tone signal;
Pout is the output power level of the tone signal;
G is the small signal gain of the Device Under Test (DUT).
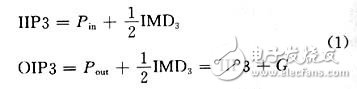
IMD3 is a third-order intermodulation distortion, which is equal to the output power level of the interfering signal minus the value of the third-order intermodulation power level, ie:
![]()
The relationship between the elements in the formula (2) is shown in Fig. 2. It is known from the equations (1) and (2) that the value of the input/output IIP3 can be obtained by measuring the level values ​​of the input/output power and the third-order intermodulation component of the tone signal.
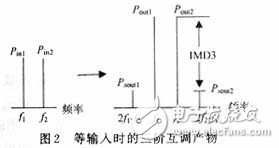
The general test method of IP3 is to build a test environment according to Figure 3, input two strong monophonic signals to the DUT, and measure the level of the monophonic signal at the output of the DUT and the level of the third-order intermodulation products, and then use the formula (1). And equation (2) calculates the size of IP3.
When the linearity of the DUT is good, its IP3 is higher. There are two characteristics to test this IP3: one is that the input monophonic signal is strong; the other is that the third-order intermodulation component is weak. Because the strong signal input is easy for other devices in the test system to enter the nonlinear state, the intermodulation component or other clutter of the same frequency is generated; the weak intermodulation component is easily covered by the large signal, so the test work of the high IP3 cannot be simply followed by the general test method. To proceed, some improvements are needed:
(1) Select high quality signal source
The signal source itself is non-linear and has a certain dynamic range. When the signal source outputs a high-power signal, some devices enter a nonlinear state, which greatly degrades the output signal quality, such as containing various clutter or multiple harmonics. Therefore, it is necessary to use a high-quality signal source, such as a composite signal source, which has higher linearity and lower noise.
(2) Isolate two sources to reduce their interaction. If the two sources are not isolated, their adaptive logic circuits will interact to produce intermodulation components [3], which affect the testing of DUT weak intermodulation components. It is therefore preferable to add an isolator between each signal source and the power combiner. A ferrite magnetic material isolator is an ideal choice because of its high isolation and small loss. A fixed attenuator of 10 to 20 dB can also be used for isolation, but their isolation is not high. To compensate for the attenuation of the attenuator, the output power of the signal source needs to be increased. Therefore, it is not ideal to use a fixed attenuator.
(3) Select a linear good power synthesizer
The power synthesizer also has a certain nonlinearity. When a strong signal is encountered, it also produces the same-frequency intermodulation component. If its intermodulation component is large, it will mask the weak intermodulation component generated by the DUT. Therefore, it is necessary to use a power combiner that is easy to match and has high linearity, such as a resistive power combiner. He is basically completely linear, does not produce intermodulation components, and each port has good matching.
(4) Enhance the matching of test systems
The matching of the system is very important. To ensure a good system matching, a fixed attenuator of 6~10 dB can be added between the power synthesizer and the DUT and between the spectrum analyzer and the DUT [3]. The system uses a 50Ω match.
(5) Select a spectrum analyzer with a large dynamic range
The dynamic range of a spectrum analyzer is the ratio of the maximum signal to the minimum signal that exists simultaneously at the input of a spectrum analyzer that can measure a small signal with a given uncertainty. When testing high IP3, the amplitude of the single tone signal of the input spectrum analyzer is large and the amplitude of the third-order intermodulation component is very small. If the dynamic range of the spectrum analyzer is not enough, the size of the two signals cannot be measured at the same time. Dynamic range spectrum analyzer.
(6) Need to discriminate the validity of the test results
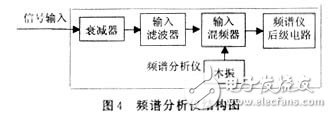
The front end structure of the spectrum analyzer is shown in Figure 4. The IP3 of the spectrum analyzer is usually not high. For example, the Agilent PSA Series spectrum analyzer (E444xA) has an IIP3 of less than +20 dBm when the mixer input level is -30 dBm. Therefore, the nonlinearity of the spectrum analyzer cannot be ignored when testing high IP3, and the strong single tone signals input to the DUT are also mutually modulated in the spectrum analyzer to generate intermodulation components of the same frequency. When the intermodulation component is large, it is necessary to determine whether the intermodulation component displayed on the spectrum analyzer is mainly generated by the DUT or by the spectrum analyzer itself, that is, whether the test result is valid. The following summarizes three methods of judgment:
1 Change the attenuation of the RF input attenuator of the spectrum analyzer (such as increasing or decreasing 10 dB), and observe whether the level value of the intermodulation component is correspondingly reduced or increased. If the level value changes, it means that the intermodulation component level value generated by the spectrum analyzer cannot be ignored, and the test result is invalid. This is the easiest way to judge.
2 Compare the intermodulation component level values ​​measured by DUT and without DUT when the other conditions are unchanged. If the latter's level value is much smaller than the former, it means that the measured result is the intermodulation component produced by the DUT; otherwise, the test result is invalid.
3 The general spectrum analyzer will give the magnitude of the third-order intermodulation distortion of each frequency band when the input signal level of the mixer is a certain value (such as -30 dBm) or directly give the value of IIP3 in each frequency band. Therefore, the magnitudes of the third-order intermodulation components generated by the spectrum analyzer can be calculated using equations (1) and (2). Comparing the calculation results with the test results, if the calculated value is much smaller than the test result, the test result is a valid value.
When the test results are invalid, one of the solutions is to reduce the input level of the two monophonic signals or increase the attenuation of the input attenuator of the spectrometer. The other is to subtract the size (mW) of the intermodulation component of the spectrum analyzer obtained by the judgment method 3 by using the test result (dBm converted to mW), thereby obtaining the magnitude (mW) of the DUT intermodulation component.
Also pay attention to during the test:
(1) The calculation formula (1) of IP3 is obtained on the assumption that the levels of the two interfering signals of the input DUT are equal. If the levels of the two interfering signals are not equal, the calculation formula needs to be adjusted [1]:
(2) In general, when the amplitude of the two monophonic signals is reduced by 1 dB, the level of the third-order intermodulation component will be reduced by 3 dB, and IMD3 will be increased by 2 dB. It can be seen that reducing the input amplitude of the tone signal can greatly reduce the amplitude of the third-order intermodulation component.
Therefore, to reduce the impact of nonlinearity of other components in the test environment on the test results, the most effective method is to reduce the level of the tone signal as much as possible.
(3) The connecting cable in the test environment should be bent as much as possible (especially at the joint) to prevent increased signal reflection, excessive intermodulation products, and affect test accuracy. In order to maintain the stability of the intermodulation characteristics of the test system, the test environment should not be easily moved, and the connectors of each port should be tightened.
3 experimentsAccording to the test method, the IP3 of the CDMA2000 base station receiving channel RF input portion (from the low noise amplifier output to the first mixer output) was tested. The test schematic diagram is shown in Figure 5. Among them, E4432B and E4440A are Agilent test instruments. The tone signal output from the source is determined according to the 3GPP2 protocol requirements: off center frequency (454 MHz) + 900 kHz and +1700 kHz, respectively.
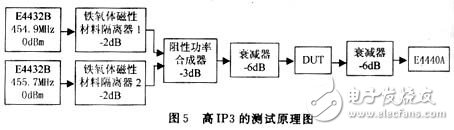
The signal frequencies at the output of the mixer are 70.9 MHz and 71.7 MHz, respectively, which deviate from the IF frequency (70 MHz) + 900 kHz and +1 700 kHz, respectively. The E4440A measures the level of the DUT signal after passing through the attenuator. Both are -17.8 dBm. Table 1 is the test results.
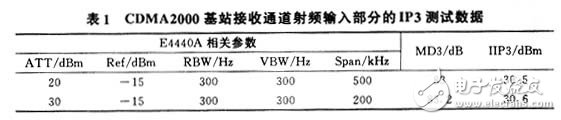
If the general test method is used, the IIP3 value obtained is 28.7 dBm. It can be seen that the high IP3 test method described above greatly improves the test accuracy of high IP3.
4 ConclusionWith the rapid development of wireless communication, the requirements for communication products need to be higher and higher, and the accurate measurement of product performance is more and more important. Linearity is an important factor affecting the performance improvement of the system. Doing an accurate test of IP3 is an important prerequisite for studying and improving the linearity of the system. This high IP3 test method has been well applied in the IP3 test of the RF part of the 3G base station, and it is hoped that it can help the IP3 test work of other products.
Liquid Crystal Display For Home Appliances
Liquid Crystal Display For Home Appliances,High Resolution Portable Lcd Display,Refrigerator Lcd Liquid Crystal Display,Response Fast Remote Lcd Monitor
Dongguan Yijia Optoelectronics Co., Ltd. , https://www.everbestlcdlcms.com