Below, a brief introduction to some of the features of the software.
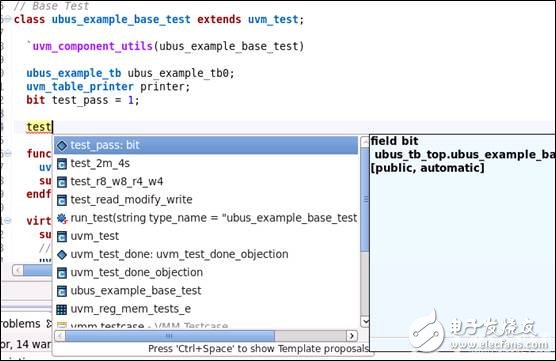
First, automatic completion
Enter a part, press ctrl + space, a dialog box will pop up, select the content to be automatically completed.
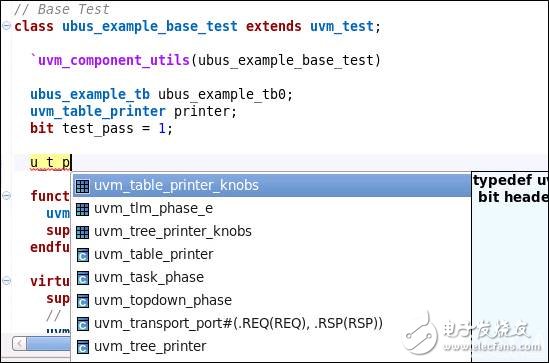
DVT also supports, abbreviated completion, such as the above uvm_table_printer, you can enter u_t_p, then press ctrl + space, it will automatically complete into uvm_table_printer.
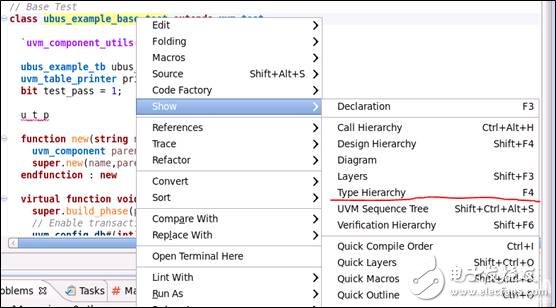
Second, the type hierarchy of the display class
For a class, you can view the type hierarchy of that class.
For the class name, right-click Show->Type Hierarchy, or F4.
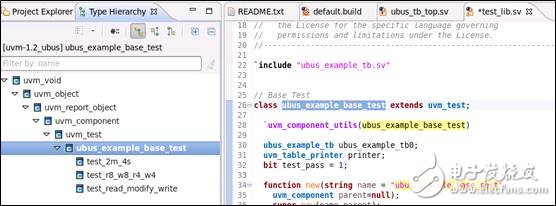
You can display the category hierarchy of a class. It can be seen that in this class, the ubus_example_base_test class inherits uvm_test, uvm_test inherits uvm_component, and finally inherits from uvm_void, while ubus_example_base_test has three subclasses, namely test_2m_4s, test_r8_w8_r4_w4, and test_read_modify_write.
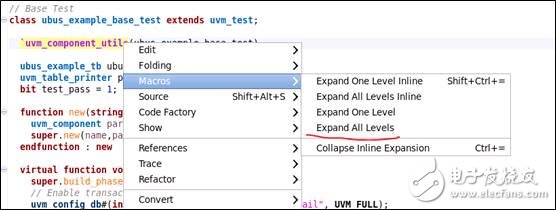
This feature is a feature that I feel I have a bright spot. For v, sv macros, whether it is VCS tools, IRUN tools, etc., can not expand the macro, so that we can clearly see the code after the macro is replaced, but the DVT tool provides This feature.
For example, in UVM, we will use the `uvm_component_utils macro to register classes. But after this macro is expanded, it is not known.
For macro names, right click, Macros->Expand All Levels.
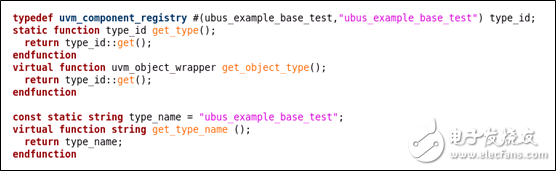
You can see the code of the macro after the expansion, and the macro parameters have been replaced. From here, it can also be clearly seen that the type_id is a class type in the class.
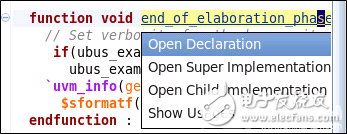
For a function, you can view the declaration of the function. For the included file, you can view the source file. For things that need to be viewed, mouse over it, then hold down the ctrl key, a dialog box will pop up, and a selection will be made to achieve the jump.
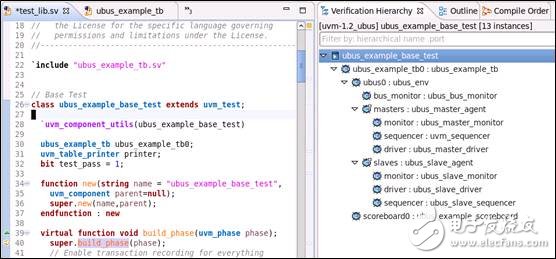
For the environment built by UVM, we usually use the print_topology function to print out the structure of UVM in the environment. But in DVT, you can directly view the structure of the UVM.
For the top level of test, right click, Show->Verification Hierarchy.
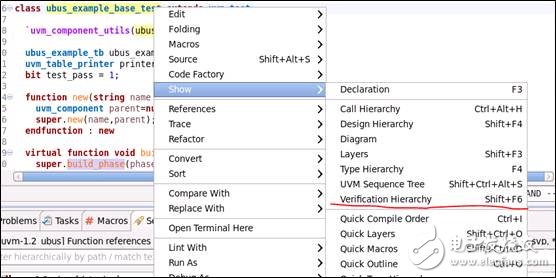
In the Verification Hierarchy on the right, the structure of the UVM is displayed when ubus_example_base_test is the top level of the UVM.
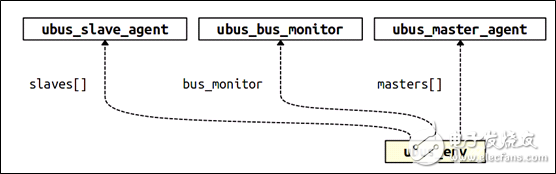
For the class name, right-click Show->Diagram.
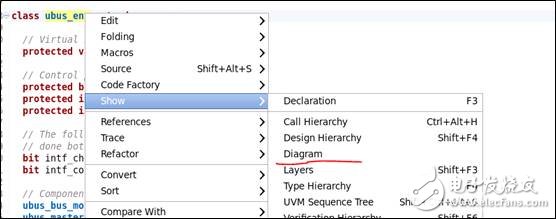
You can get a UML diagram of this class.
For the following variables, you want to use the field automation mechanism.
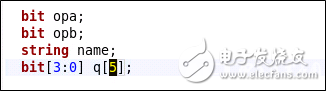
Code area, right click, Source->UVM Field Editor.
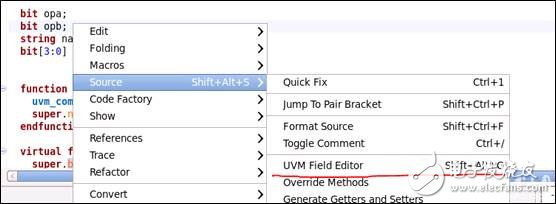
A dialog box pops up, select the variable that needs field automation on the left, and select the parameter on the right.
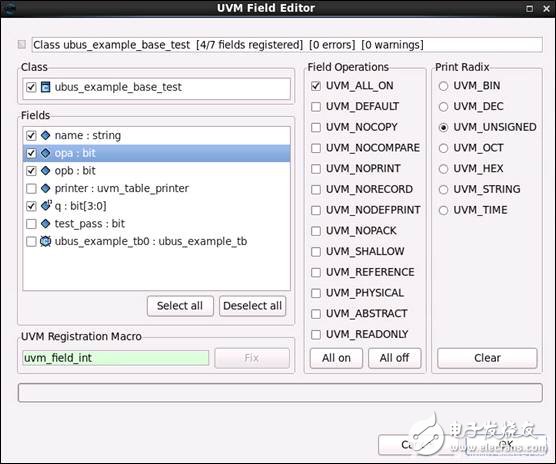
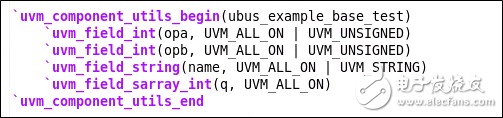
Click OK and the code will be generated.
For working under linux, generally like to use vi, or emacs, DVT function, also supports these editors.
In the upper right corner, there are 4 boxes of graphics with a drop-down menu on the side, you can choose which editor to use.
Nine, code format adjustmentThe format is not friendly for the following code.
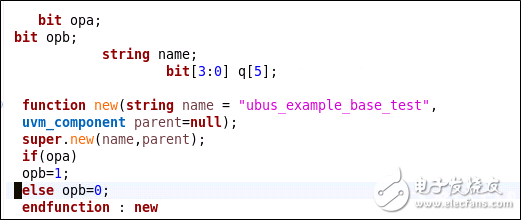
Code area, right click, Source->Format Source. Adjust the code format.
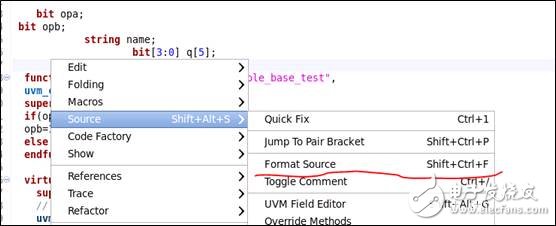
After the adjustment, the format becomes friendly.

You can perform line operations on the project and perform statistics.
Project right, Lint with->SystemVerilog UVM Compliance Rules.
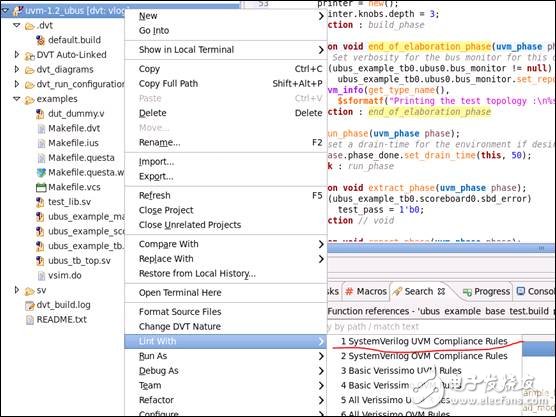
A dialog box pops up and you can make selections as needed.
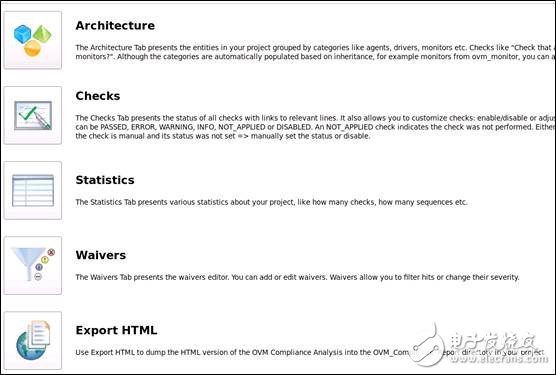
For Architectry, each class is displayed according to the classification.

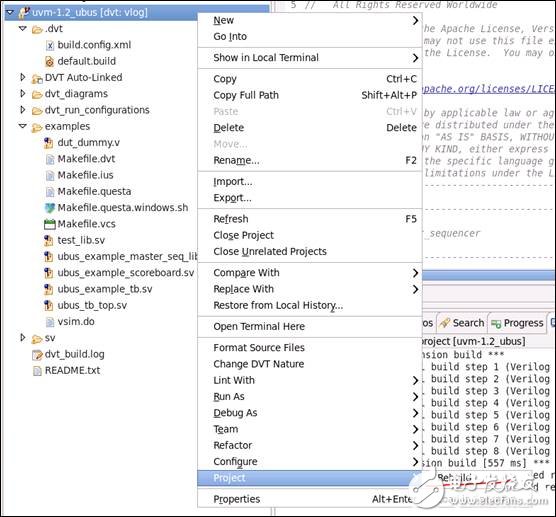
After the code has been modified, you must rebuild it.
Project right click, Project->Rebuild.
There are a lot of functions of this software, which requires everyone to try and find out more when using it.
Pin Header Connector,Pin Header Female,Male Header Pins,Right Angle Pin Header
Cixi Xinke Electronic Technology Co., Ltd. , https://www.cxxinke.com