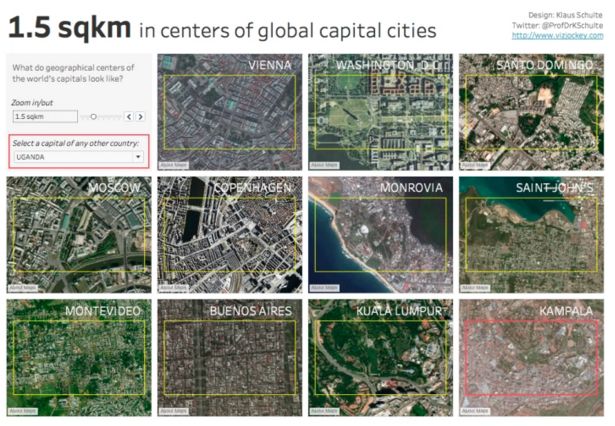
Recently, I made a Viz work in which I used the method of creating custom zoom controls for multiple maps.
➤Copy the link below to your browser to view this Viz:
https://public.tableau.com/profile/klaus.schulte#!/vizhome/CentersoftheWorldsCapitals/Dashboard1?publish=yes
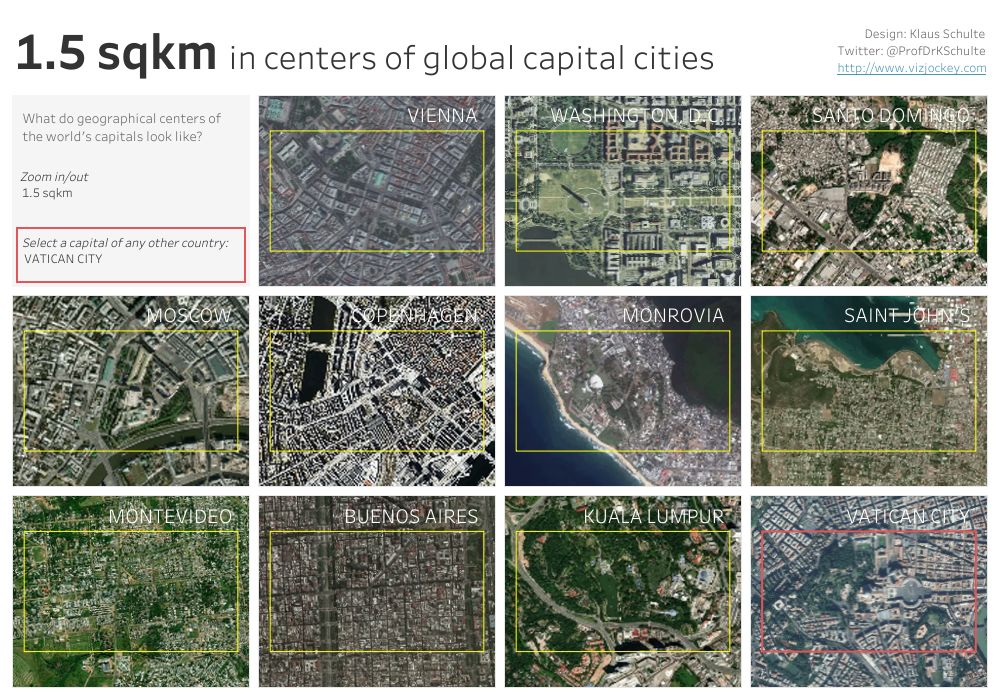
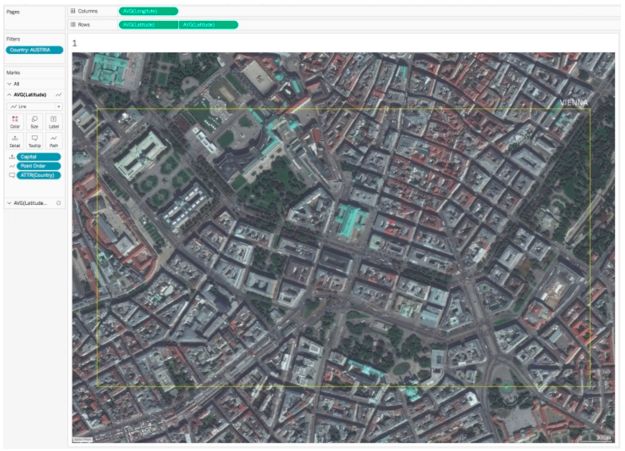
With the "zoom in / out" parameter on the left, you can change the size of the bounding box, and since Tableau will automatically adjust its map, it looks like you can zoom in and out. If I fix the map, changing the parameters will only change the size of the frame in the view.

Today, I will share in this article the specific steps I took to build this visualization.
1
Find some data you want to plot
I want to be able to view the centers of capitals around the world, mainly because it is very easy to identify geographic centers in Tableau:
Import a list of countries and cities in Tableau
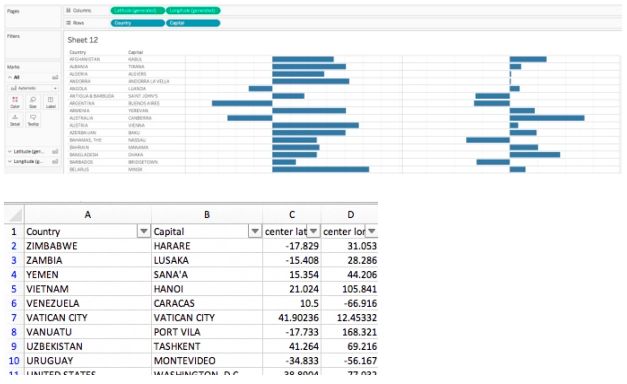
Create a view containing the generated latitude and longitude
Export worksheet as crosstab to Excel
2
Prepare the data
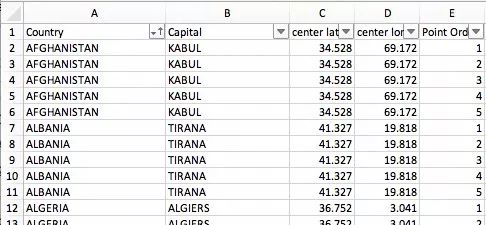
First we need to draw a bounding box with 5 points. Therefore, I processed the data 5 times and identified the 5 data in dot order. This is all the data preparation you need (you can even complete this step in Tableau).
3
Construct bounding box
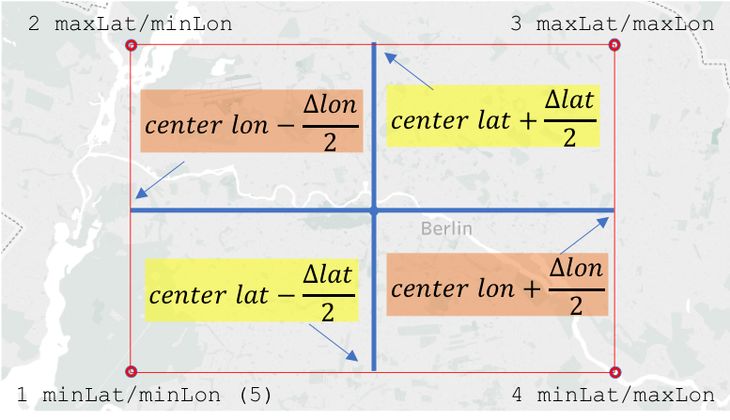
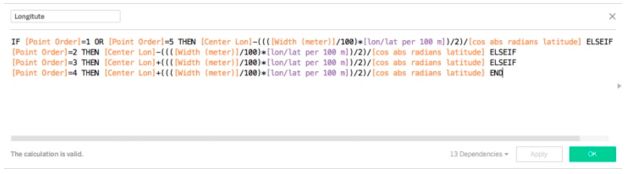
Then I can use Δlon (width), Δlat (height) and some basic mathematical knowledge to construct a bounding box around the city center:
But after that it became tricky. Because the early version of Viz looks like this:
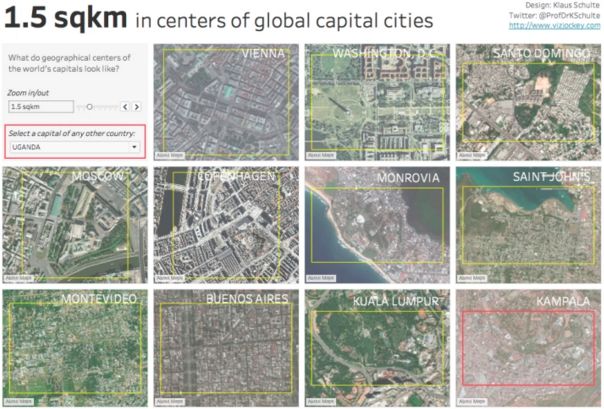
The size in each box is different. So what happened here?
4
Some basic knowledge of space
I am not a space expert, so it took me some time to figure it out. As mentioned in 3, I want to add or subtract the latitude/longitude with the latitude/longitude of the center point. But unfortunately, the distance expressed in latitude/longitude depends on your position on the earth (so the size of the box is different).
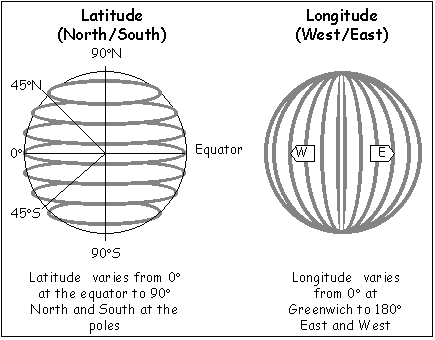
Source: Wikipedia
This is because the distance between the two longitudes is not determined. Although the distance between two latitudes is a constant (111.12 km), the distance between longitudes has a maximum value at the equator (here it is also 111.12 km) and is 0 at the pole.
The distance between two longitudes can be calculated like this:
Distance = 1 nautical mile * 60 *cos(Latitude)
Distance at the equator = 1,852 m * 60 *cos(0) = 111,120 m (or 111.12 km) with cos(0)=1
The longitude distance at 45 degrees latitude is:
1,852 m * 60 * cos(45) = 78,573.7 m
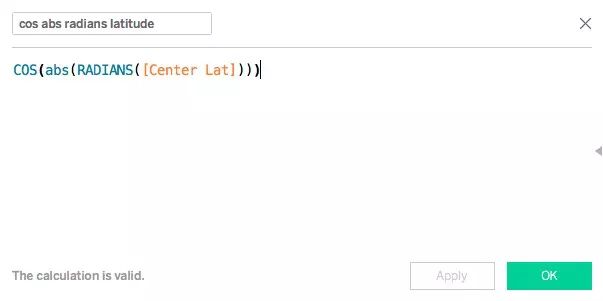
This means that the distance expressed in longitude has different lengths around the world, depending on the latitude. In order to eliminate this effect, I only need to use the latitude cosine calculation to normalize the Δlon (width) in Tableau. The formula is as follows:
So far everything goes well.
5
Bounding box size setting
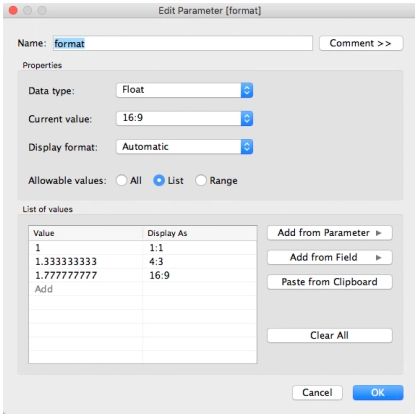
In the early version, I created two parameters to represent the height and width (in latitude and longitude) and drew the box, but then I thought it would be cool to use only one parameter to represent the area of ​​the box (square kilometers). Therefore, I have to calculate the height (x) and width (y) in Tableau.
In order to complete this idea, it needs the following two equations:
(1) s = x * y
(2) f = y/x with f=format of the box (eg16:9, 4:3 or 1:1)
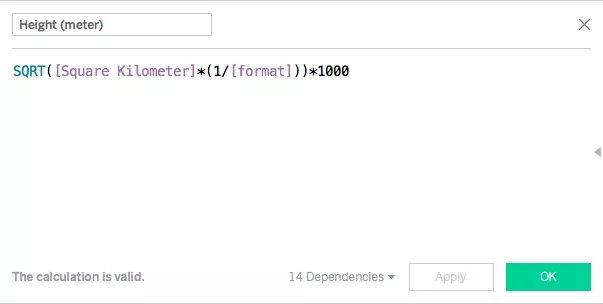
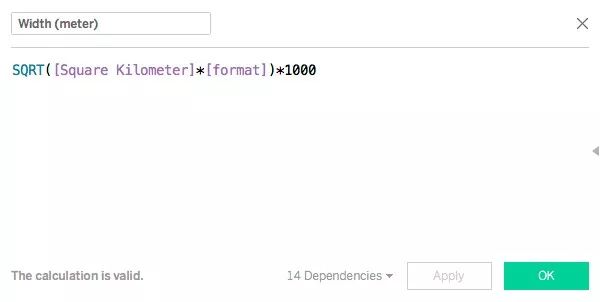
Then I can calculate the height and width based on my parameters Square Kilometers (square kilometers), format (format) and lat/lon per 100m (latitude/longitude per 100 meters):

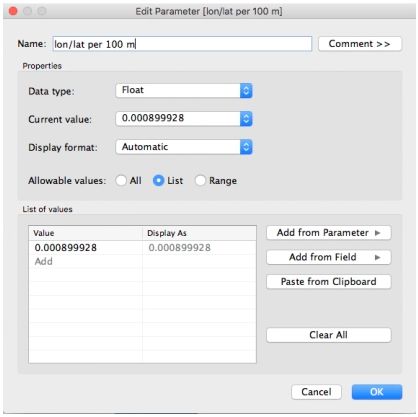
Substitute into these two calculated fields:
6
Put everything together
The last step before creating the view is to calculate the longitude and latitude of each point of the data.
latitude:
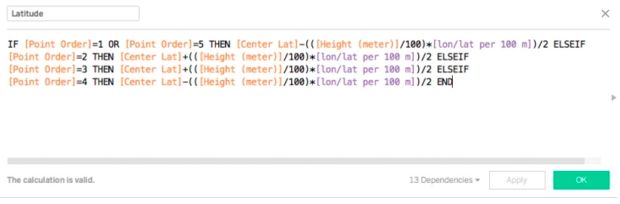
longitude:
7
Create Viz
To create this Viz I used the same steps described in the previous article.
For the second axis, I selected the circle in the mark card and placed my label in the formula below.
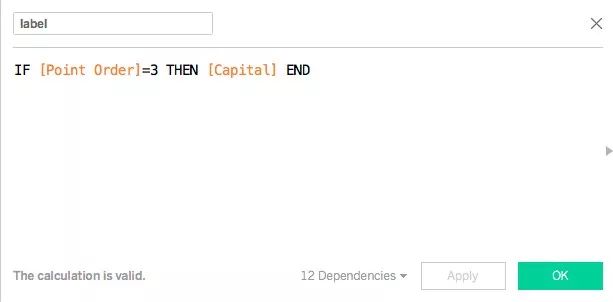
Add a little formatting and it's all done!
I hope you like this article, and I hope you can find a place to use this method!
Insulated Terminals,Terminals,High-quality insulated terminals
Taixing Longyi Terminals Co.,Ltd. , https://www.longyiterminals.com