•Application area
Noise, vibration and harshness NVH (Noise, VibrATIon, Harshness) is a comprehensive problem to measure the quality of automobile manufacturing. It gives car users the most direct and superficial feeling. It is one of the concerns of major automakers and component companies in the international automotive industry. Statistics show that about one-third of the problem with the vehicle is related to the NVH problem of the vehicle, and nearly 20% of the major companies' R&D expenses are spent on solving the NVH problem of the vehicle. For the car, the NVH problem is everywhere. Studying and designing the noise vibration signal analysis system has certain significance for solving the corresponding NVH problem.
•challenge
Utilize ADLINK to produce high-performance data acquisition card PCI9846 and National Instruments (NI) LabVIEW8.6 design data acquisition and analysis system to achieve signal acquisition and analysis and processing of signals. Since various errors are inevitable in the process of discrete spectrum analysis, how to improve the accuracy of spectrum analysis and perform spectrum correction on signals is a problem that the system needs to solve.
•Use of the product
The data acquisition and analysis system adopts ADLINK PCI9846, the software uses National Instruments (NI) LabVIEW8.6, and the operating system is Windows XP.
•solution
Based on the advantages of virtual instrumentation, the high-performance data acquisition card PCI9846 and National Instruments (NI) LabVIEW 8.6 design data acquisition and analysis system with 4 channels, 16 sampling accuracy and maximum sampling rate up to 40MS/s are produced by ADLINK. In the system, the spectral correction analysis is performed on the signal by the discrete spectrum correction method such as ratio correction method, energy center-of-gravity correction method, FFT+FT continuous refinement analysis Fourier transform method and phase difference method to improve the signal analysis accuracy.
A complete signal analysis system usually consists of three parts: signal acquisition and acquisition, signal analysis and processing, and output and display of results. Traditional test instruments are basically in the form of hardware or solidified software, which is defined and manufactured by the manufacturer. The design of traditional instruments is more complicated, the flexibility is poor, and there is no way to get rid of the independent use and manual operation. The whole test process is almost limited to the simple steps of imitating manual test, and it is not suitable for some occasions with more complicated and more test parameters. Compared with traditional instruments, Virtual Instrument has obvious advantages such as high efficiency, openness, flexibility, powerful function, high cost performance and good operability. The specific performance is: high intelligence, strong processing power, and reuse. Strong, low system cost, and operability. Based on the advantages of virtual instrumentation, the data acquisition and analysis system was designed using PCI9846 and LabVIEW for automotive NVH analysis.
1 system compositionVirtual instruments are becoming a popular instrumental component in the world today. The virtual instrument is based on a computer, combined with the corresponding hardware and software, to complete the data collection and processing. Its architecture is open, it combines a computer platform with hardware modules with standard interfaces and with development test software to form an instrument system that is versatile and flexible for developing test applications.
1.1 Hardware composition
The hardware system is mainly composed of a computer, and the data acquisition card inserted therein is the main functional component. After the signal to be measured is received by the data acquisition card, it is transmitted to the inside of the computer, and the corresponding software performs subsequent analysis and processing. Therefore, the data acquisition card is the key to the successful design of the virtual instrument.
The data acquisition card used in this system is PCI9846 produced by ADLINK. PCI9846 is a high-speed digitizer with 4 channels, sampling accuracy of 16 bits and sampling frequency of 40MS/s. It provides high precision, low noise and high dynamic range performance, high density and high precision. Designed with high frequency and high dynamic range signals with signal frequencies up to 20MHz. The analog input range can be programmed to ±1V/±0.2V or ±5V/±0.4V. The PCI9846, equipped with up to 512MB of onboard memory, is free from the constraints of the PCI bus, allowing it to store longer waveforms.
1.2 Software Platform
The software part is the heart of virtual instruments. At present, the widely used virtual instrument-based graphical programming software development platform is mainly LabVIEW (Laboratory Virtual Instrument Engineering Workbench) developed by National Instruments Corporation (NITIonal Instrument). platform). LabVIEW is a graphical programming development environment based on G (Graphic) language. It is widely accepted by industry, academia and research laboratories. It is used as a standard language for developing data acquisition systems, instrument control software and analysis software. This kind of language programming, basically do not write program code, is an ideal language for scientific research and engineering applications. It uses as much as possible the terms, icons, and concepts familiar to technicians, scientists, and engineers, so LabVIEW is a tool for end users. LabVIEW integrates all the functions of communicating with hardware and data acquisition cards that meet the GPIB, VXI, RS-232, and RS-485 protocols. It also has built-in library functions that make it easy to apply software standards such as TCP/IP and AcTIveX. This is a powerful and flexible software that makes it easy to build your own virtual instruments with a graphical interface that makes programming and usage fun and interesting. It enhances the ability to build users' scientific and engineering systems, providing an easy way to implement instrument programming and data acquisition systems. When it is used for principle research, design, testing and implementation of instrument systems, it can greatly improve work efficiency.
LabVIEW has a rich library of functions that greatly shortens the development cycle and makes applications that are easy to maintain and extend. The LabVIEW development environment is used to develop data acquisition and analysis application software. Combining the data acquisition card PCI9846 with the flexible and convenient application software development platform LabVIEW can reduce development costs and shorten the development cycle, making development convenient and efficient.
1.3 LabVIEW Control Capture Card
PCI9846 provides the LabVIEW driver. When installing the driver, it will automatically find the LabVIEW directory, and then copy the necessary files to the corresponding folder. If LabVIEW is not installed in the system or its version is lower than 6.0, the driver installer will pop up a dialog box. Prompt to update the version of LabVIEW. Once the LabVIEW driver is installed, you can use the PCI9846 in LabVIEW for data collection.
After the LabVIEW driver installation is completed, the corresponding item shown in Figure 1 will be added to the function palette. In this article, the "DAQPilotExpressVI" can be directly used, and the corresponding data can be collected according to the prompts (Figure 2).
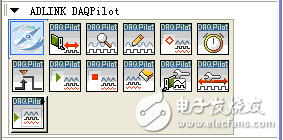
Figure 1 LabVIEW function palette new
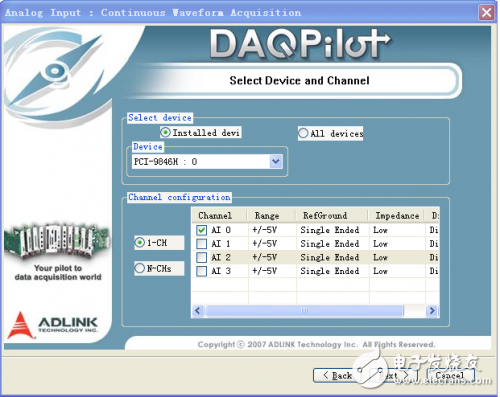
Figure 2 Configuration Wizard
2 signal analysisAfter the data collection is completed, the data must be analyzed to extract the corresponding information from it. The data analysis of this system is mainly concentrated in the frequency domain. Signal analysis processing is an important part of LabVIEW. It provides a large number of highly specialized signal analysis and processing functions. The common analysis of signals can directly meet the requirements by using LabVIEW off-the-shelf functions, but it is used to process signals more complexly. You need to write your own functions.
The frequency, amplitude and phase of the discrete-Fourier transform and spectrum analysis of harmonic signals may have large errors. Theoretically, the maximum amplitude error of discrete-spectrum analysis of single-frequency harmonic signals plus rectangular windows can reach 36.4%; even When adding other windows, this error can not be completely eliminated. The maximum amplitude error when the Hanning window is added and only the amplitude recovery is still up to 15.3%; the maximum phase error of the discrete spectrum analysis is up to ±90 degrees regardless of the window function. The maximum frequency error is ±0.5 frequency resolution. Therefore, the results of spectrum analysis can only be qualitative in many areas and cannot accurately quantify and solve problems, which greatly limits the engineering application of the technology, especially in mechanical vibration and fault diagnosis. Therefore, the parameters of each frequency component obtained by discrete spectrum analysis are corrected to obtain more accurate frequency, amplitude and phase estimates. Therefore, it is necessary to study the correction theory and technique of discrete spectrum to eliminate or greatly reduce this error and improve the analysis accuracy. Correction is performed on discrete spectra of single frequency components or multi-frequency components that are far apart.
At present, there are four methods for correcting the amplitude spectrum or power spectrum at home and abroad: ratio correction method (interpolation method), energy center of gravity correction method, FFT+FT continuous refinement analysis Fourier transform method and phase difference method; phase difference method It is divided into time shift method, window length change method and comprehensive method. Theoretically, the ratio method and the phase difference method are accurate correction methods when the signal is free of noise, and the energy center of gravity method and the FFT+FT spectrum continuous refinement analysis Fourier transform method are highly accurate approximation methods.
With the development and continuous improvement of discrete spectrum correction technology, it is more and more widely used in the analysis of various practical problems and various dynamic signal analysis systems. Discrete spectrum correction theory has been or will be widely used in the following fields:
(1) Various types of dynamic signal analyzers and computer-aided test systems;
(2) Rotating mechanical vibration signal, rotating machinery with sliding bearing, the working speed is mostly stable, and the phase is required as the analysis parameter. In this case, the ratio correction method is the best;
(3) Torsional vibration signals such as engine. For the steady-state torsional vibration signal, only the amplitude of each harmonic is needed to be accurately determined. Since the three-point convolution correction method is not affected by small fluctuations in the rotational speed, it is the steady-state torsional vibration signal. best choice;
(4) The application in the field of instrumentation has been applied to instruments and meters such as vortex flowmeters and electric system electrical parameters that require precise frequency measurement to calculate physical quantities;
(5) Power system harmonic analysis;
(6) Improve accuracy in laser Doppler velocity measurement;
(7) High-precision frequency and amplitude calibration system. At present, there is still a blank in the field of accurately calibrating the frequency and amplitude of dynamic signals. The calibration method can be developed with the high-precision A/D board to fill the calibration instrument. Blank space
(8) Precision analysis of various vibration signal spectrums;
(9) Cyclostationary demodulation analysis, using discrete spectrum to correct the demodulated modulation frequency and amplitude, greatly improving the analysis accuracy, and more accurately extracting fault information;
(10) Military field of radar precision ranging and electronic countermeasures.
2.1 ratio correction method (interpolation method)
In this method, the window spectral function ratio of the two spectral lines near the peak of the main lobe with a difference of 1 after the frequency normalization is used, and an equation with the normalized correction frequency as a variable is established to solve the normalized correction frequency, and then Perform frequency, amplitude, and phase correction; this method is suitable for discrete spectral correction in the case of theoretical expressions of the Fourier transform of the symmetric window function.
The correction frequency is:
![]() (1)
(1)
Where k(k=0,1,2,...,N/2-1) is the line number and N is the number of analysis points. ![]() Is the sampling frequency. The spectral mode function of the window function is
Is the sampling frequency. The spectral mode function of the window function is ![]() , the amplitude is corrected to:
, the amplitude is corrected to:
![]() (2)
(2)
After the spectral line correction is obtained by spectral correction, the phase correction amount is:
![]() (3)
(3)
When the real part is ![]() The imaginary part is
The imaginary part is ![]() When the true phase angle is:
When the true phase angle is:
![]() (4)
(4)
Characteristics of the ratio correction method:
(1) A general-purpose discrete-spectrum correction method for the analytical expression of the known normalized window function; it can accurately correct the frequency, amplitude and phase of the discrete spectrum of single-frequency harmonic signals, greatly improving the accuracy of discrete spectrum analysis. ;
(2) Solving the problem of accurately solving the parameters (frequency, amplitude and phase) of multi-frequency components with large intervals (above 5 frequency resolutions) theoretically and practically;
(3) The algorithm is simple and the calculation speed is fast;
(4) Regardless of the influence of noise in the signal, the ratio method is an accurate correction method. The corrected frequency, amplitude and phase are theoretical values, but will be affected by the digital truncation error in the digital calculation. error;
(5) Not applicable to the correction of discrete spectrum analysis of signals with excessively dense frequency components and continuous frequency component signals.
2.2 Energy Center of Gravity Correction
The method is a discrete spectrum correction method based on the characteristic that the energy center of gravity of the discrete spectrum of the symmetric window function is infinitely approximated to the origin of the coordinate or near the origin, and is a universal discrete spectrum correction method suitable for adding various symmetric windows. . Taking the Hanning window as an example, because the power spectrum value of the window side lobes is small, according to the characteristics of its energy center of gravity, if X is in the range of [-0.5, 0.5], the power spectrum value in the main lobe can be used. Several lines accurately determine the center coordinates of the main lobe. Set the sampling frequency to ![]() The number of spectral points is N, the spectral line number of the peak in the main lobe is m, Yi is the i-th spectral value of the power spectrum, and x0 is the center of the main lobe. The frequency correction formula is:
The number of spectral points is N, the spectral line number of the peak in the main lobe is m, Yi is the i-th spectral value of the power spectrum, and x0 is the center of the main lobe. The frequency correction formula is:
![]()
![]() (5)
(5)
Set the energy recovery coefficient to ![]() , the corrected amplitude is:
, the corrected amplitude is:
 (6)
(6)
The corrected amount of the normalized frequency is ![]() , there are:
, there are:
![]() (7)
(7)
The correction phase can be obtained by combining equations (3) and (4).
Features of the energy center of gravity correction method:
(1) A general discrete spectrum correction method applicable to any spectrum of symmetric window functions, which can greatly improve the analysis accuracy of discrete spectrum;
(2) It can directly correct the multi-segment average power spectrum compared to other correction methods;
(3) The algorithm is simple and the calculation speed is fast;
(4) The error caused by the interference phenomenon caused by the negative frequency component and the multi-frequency component with close spacing is small;
(5) The correction accuracy is related to the window function, and the correction accuracy is higher when the Hanning window is added;
(6) The correction accuracy is related to the number of points involved in the correction. The more points, the higher the correction accuracy for the single frequency component, but the higher the frequency interval between the two adjacent peaks is required;
(7) Regardless of the influence of noise in the signal, the energy center of gravity method is a highly accurate approximation correction method. After correction, the frequency, amplitude and phase are not theoretical values, but the error is small;
(8) Not applicable to the correction of discrete spectrum analysis of signals with excessively dense frequency components and continuous frequency component signals.
2.3 FFT+FT continuous refinement analysis Fourier transform method
The method essentially uses the FFT as the panoramic spectrum, and performs the operation on the localized reuse continuous Fourier transform FT to be refined to obtain a spectrum with extremely high local refinement precision. After the FFT of the sampled signal, in a specified frequency interval [ ![]() ,
, ![]() ], included in the interval [0,
], included in the interval [0, ![]() In the case of L-point equally spaced spectrum analysis.
In the case of L-point equally spaced spectrum analysis.
![]()
![]() (8)
(8)
![]()
![]() (9)
(9)
Determine frequency resolution ![]() After calculating the frequency sequence {
After calculating the frequency sequence { ![]() ,
, ![]() ,
, ![]() ,...,
,..., ![]() }, according to equations (8) and (9), the real and imaginary parts of the L+1 point are calculated, and the amplitude spectrum and the phase spectrum are synthesized to correct the frequency, amplitude and phase.
}, according to equations (8) and (9), the real and imaginary parts of the L+1 point are calculated, and the amplitude spectrum and the phase spectrum are synthesized to correct the frequency, amplitude and phase.
FFT+FT continuous refinement analysis of the characteristics of the Fourier transform method:
(1) A general discrete spectrum correction method applicable to any spectrum of symmetric window functions, which can greatly improve the analysis accuracy of discrete spectrum; can greatly improve the frequency resolution and amplitude and phase without increasing the sampling length. Calculation accuracy
(2) The calculation speed is much slower than other methods, and is not suitable for real-time spectrum analysis and correction;
(3) Different from the spectrum analysis method of complex modulation and strip selection, since the length of the window is not increased, only the amplitude and phase of the local frequency of the signal can be refined, but the main lobe which has been very dense and cannot occur The overlapping and interfering multi-frequency signals are separated into a plurality of single-frequency component signals in which main lobe overlap and interference do not occur, and therefore are not applicable to the correction of discrete spectral analysis of frequency components and continuous frequency component signals.
2.4 phase difference method
The phase difference method is divided into a time shift method, a window length change method, and a synthesis method. The essence is that the same signal is continuously sampled to obtain two time series, wherein the second time domain sequence lags the first segment by a certain number of points, and the same or different window functions are added to the two time domains respectively. Or FFT (or DFT) analysis of the same number of points, using the phase difference of the corresponding peak line for discrete spectrum correction, the method is suitable for discrete spectrum correction in the case of adding various symmetric windows. There are three methods for phase difference correction: the first method is to change the window length method, the second method is time domain translation method, and the third method is comprehensive correction method, real-time domain translation + changing window length + adding different window function method. This method is suitable for discrete spectrum correction in the case of adding various symmetrical windows.
In this method, the spectrum is corrected by the difference between the phases of the two time-series FFTs. The original single-frequency component signal adopts two consecutive samples, and then the Fourier transforms are performed on the two segments, and the phase difference of the corresponding discrete spectral lines is corrected. Correction method for accurate frequency and phase at the peak. Discrete Fourier transform is performed after adding the same window function to both signals. The transformed phase frequency function not only has a linear relationship in the main lobe of the window function, but also has the same slope.
![]() (10)
(10)
![]() (11)
(11)
Phase difference ![]() for:
for:
![]() (12)
(12)
Normalized frequency correction:
![]() (13)
(13)
The correction frequency is:
![]() (14)
(14)
The corrected amplitude is:
![]() (15)
(15)
Features of the phase difference correction method:
(1) It has good versatility, and its correction method is not affected by the different windowing function. It is a general discrete spectrum correction method suitable for adding any symmetric window function.
(2) The algorithm is simple and the calculation speed is fast;
(3) Strong ability to resist noise interference;
(4) Regardless of the influence of noise in the signal, the phase difference method is an accurate correction method. The corrected frequency, amplitude and phase are theoretical values, but will be affected by digital truncation errors in digital calculations. error;
(5) Not applicable to the correction of discrete spectrum analysis of signals with excessively dense frequency components and continuous frequency component signals.
In this system, in order to improve the accuracy of data analysis, according to the ratio correction method, energy center of gravity correction method, FFT+FT continuous refinement analysis Fourier transform method and phase difference method, four commonly used spectrum correction method principles, write corresponding in LabVIEW8.6 Function to perform spectral correction processing on the data.
3 SummaryUtilizing ADLINK's high-performance data acquisition card PCI9846 and LabVIEW, combined with four new spectrum correction methods, the data acquisition and analysis system was designed for automotive vibration data analysis.
A TPU Screen Protector made of the super toughness of the honeycomb structure. Its unique ultra-soft properties allow it to cover the most complex curves and contours in a device.
The self-healing design of the Hydrogel Screen Protector can protect the display screen of the device from damage, leave no air bubbles, and maintain the sensitivity of the touch screen. Advanced anti-fingerprint and dust- and oleophobic overlays keep your screen smudge- and dirt-free. This overlay is also important in providing maximum touch sensitivity for improved high-speed glide and optimal touch response.
The optical transparency of the Hydrogel Film is more than 90%, showing you the most original screen color and bringing the most realistic visual experience.
If you want to know more about the product information of the Hydrogel Screen Protector for Samsung, please click the product details to view the parameters, model, picture, price and other information of the Samsung Screen Protector.
Whether you are a group or an individual, we will do our best to provide you with accurate and comprehensive information about Hydrogel Screen Protectors!
Screen Protector For Samsung,Hydrogel Screen Protector for Samsung,TPU Screen Protector for Samsung,Hydrogel Film for Samsung
Shenzhen Jianjiantong Technology Co., Ltd. , https://www.jjthydrogelmachine.com