The research team of the Nankai University Media Computing Laboratory and other research groups have proposed a novel, efficient, and easy-to-calculate structural metric (S-measure) to evaluate non-binary foreground maps from the perspective of the human visual system's sensitivity to the scene structure. It is not necessary to calculate the accuracy and recall rate through the tedious and unreliable multi-threshold method as in the conventional AUC curve, and a very reliable evaluation result can be obtained only by a simple calculation (5.3 ms), becoming the first simple special application in the field. Evaluation indicators. The related research has been used as spotlight paper by ICCV 2017, and the first author, Fan Dengping, a doctoral student at Nankai University, gave a detailed explanation.
The metric of the foreground image plays an important role in the development of object segmentation algorithms, especially in the field of object detection. Its purpose is to accurately detect and segment objects in the scene. However, currently widely used assessment indicators (AP, AUC) are all based on pixel-level error metrics, lacking structural similarity measures, resulting in inaccurate assessments (outstanding rankings of algorithm rankings are inferior to poorly implemented algorithms) and thus affecting the development of the field.
The joint research team of the Tianjin Nankai University Media Computing Laboratory and the University of Central Florida, USA, proposes a regional-aware and object-aware structural metric, based on the sensitivity of the human visual system to the scene structure. The (S-measure) method evaluates non-binary foreground maps, which in turn makes the assessment more reliable. This method uses five metametric metrics on five benchmark data sets to prove that the new metric method is far superior to the existing metric methods, and is highly consistent with human subjective evaluation (77% Ours vs. 23% AUC).
Problem elicited: Defects in specialized evaluation indicators
Whether the evaluation index is reasonable or not plays a decisive role in the development of the model in an area. The most widely used evaluation indicators in the existing foreground graph detection are: the average precision AP (average precision) and the area under the curve AUC (area under The curve). When evaluating a non-binary foreground image, it is necessary to threshold the input image to obtain multiple thresholds, and then calculate the precision and recall.
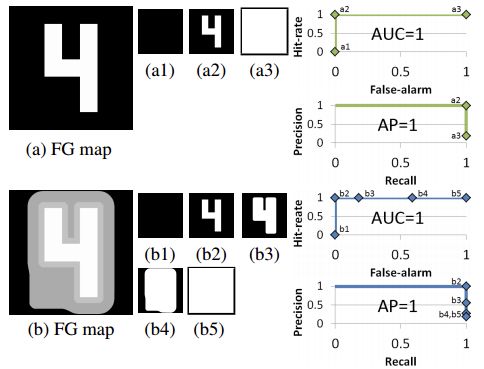
figure 1
However, this method has been proven [1] with natural defects. For example, (a) and (b) in FIG. 1 are two completely different prospects, but after thresholding the calculation of AP and AUC, the final evaluation results are AP=1 and AUC=1. This means that the detection of the two foreground images is quite equivalent, which is obviously unreasonable.
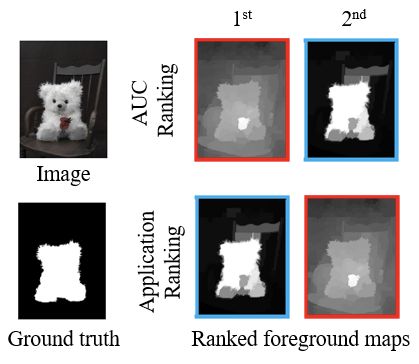
figure 2
Looking at another practical example, in FIG. 2 , according to Application Ranking and Human Ranking, the detection result of the blue box is due to the red box. However, as shown in FIG. 3, the thresholding and re-interpolation method (AUC) will evaluate the red box detection result due to the blue box.
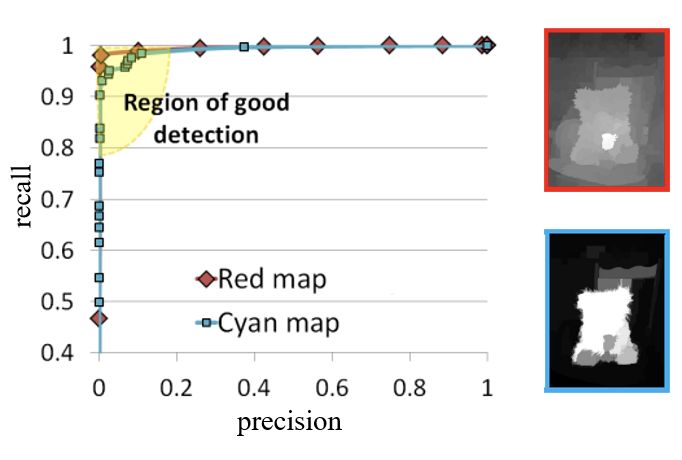
image 3
Therefore, the AUC evaluation method completely depends on the result of the interpolation, ignoring the location of the error, and does not consider the structural metrics of the object. The reason is that the AUC curve is a common evaluation indicator in many fields, and there is no simple and efficient proprietary indicator in the field of prospect detection. For this reason, it is necessary to design a specific simple and reliable evaluation indicator for this field.
Solution: Area-oriented and object-oriented structure metrics
Because the current evaluation index is to consider the error of a single pixel, the lack of structural similarity measure leads to inaccurate evaluation. For this reason, the research team started from two angles to solve the problem of structural metrics based on the perspective that the human visual system is very sensitive to the scene structure.
As shown in Figure 4: (a) Region-aware structure metrics and (b) Object-aware structure metrics.
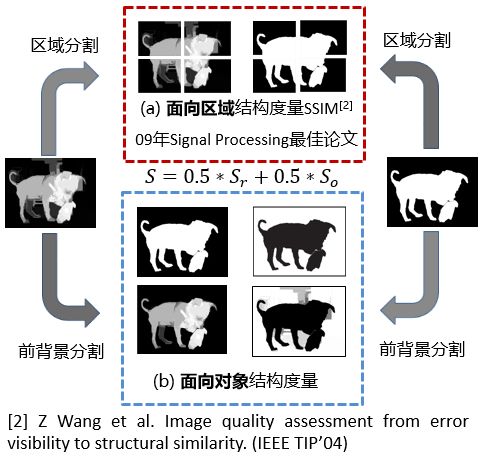
Figure 4
Area-oriented structure metrics measure the pre-background of the area as a complement to object-oriented (pre-background separation metrics), and provide support for reliable overall structural metrics.
In the calculation of the area-oriented part, the 2*2 block method is first used to cut the center of gravity of the Ground-truth. Correspondingly, the results are cut for the test result graph. This results in 4 partial blocks, and the similarity measurement method of each block adopts a well-known structure. Evaluation index SSIM to measure. Finally, according to the ratio of each block occupying the entire foreground image, the self-adaptive weighted summation is used to obtain the region-oriented structural similarity. 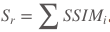 .
.
b. Object-oriented structure metrics From the perspective of objects, separating the front background metrics complements the area-oriented area (the former background aggregates into areas) to provide a guarantee for the structure of the measurement object level.
Through a large amount of research, it has been found that high-quality foreground image inspection results have the following characteristics:
The foreground and background form a strong contrast of brightness.
Both the foreground and the background are approximately evenly distributed.
As shown in Figure 5, the internal and background parts of the result of the result1 test result are relatively uniform, except that the luminance contrast is not strong enough, and the result of the result2 is that the internal objects are unevenly distributed and the background part is generally uniform.
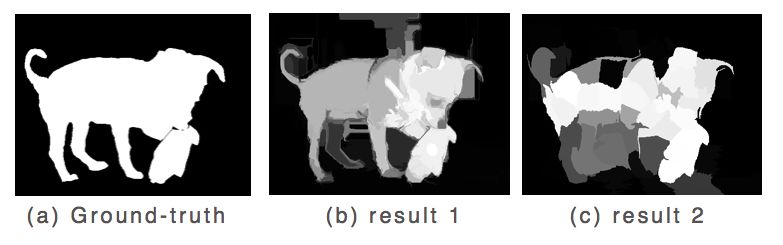
Figure 5
The research team measured structural similarity by designing a simple luminance difference and uniformity term.

Meta-metric experiments prove effectiveness
To prove the validity and reliability of the indicators, the researchers used meta-metric methods to conduct experiments. The performance of the indicator can be obtained by proposing a series of reasonable assumptions and then verifying that the indicator meets these assumptions. In short, meta-metrics are indicators of an evaluation index. The experiment uses five meta-metrics:
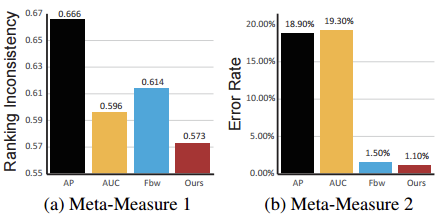
Metametric 1: Application sort
An important reason for driving the development of models is application requirements, so the ranking of an indicator should be highly consistent with the application's ranking results. That is, a series of foreground graphs are input into the application program, and the application program obtains the ranking result of its standard foreground graph. The evaluation result obtained by an excellent evaluation index should have a high degree of consistency with the ranking result of the application standard foreground graph. See Figure 6 below.
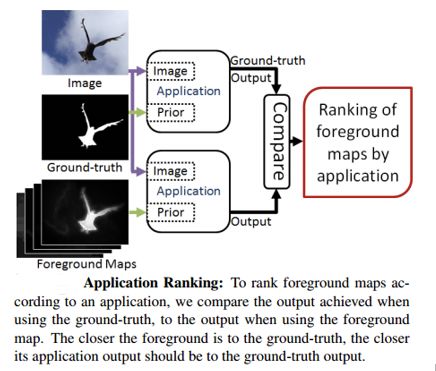
Figure 6
Metametric 2: The latest level vs. random results
The evaluation principle of an indicator should tend to select the detection results obtained using the most advanced algorithms rather than random results that do not consider the image content (eg, center Gaussian). As shown in Figure 7 below.
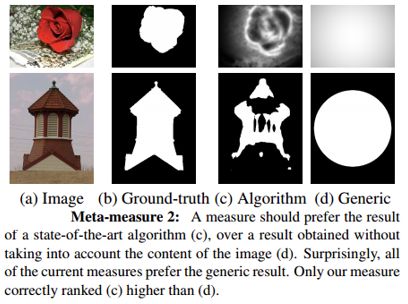
Figure 7
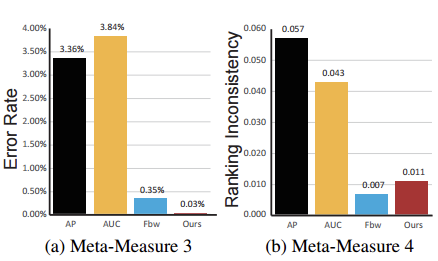
Metametric 3: Reference GT Random Replacement
The original indicator was identified as a model with better detection results. When the reference Ground-truth is replaced with the wrong Ground-truth, the score should be reduced. As shown in Figure 8.
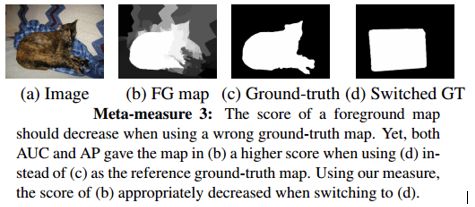
Figure 8
Meta-metric 4: slight tagging error
The evaluation index should be robust, and a good evaluation index should not be sensitive to the slight manual marking error of the GT boundary. As shown in Figure 9
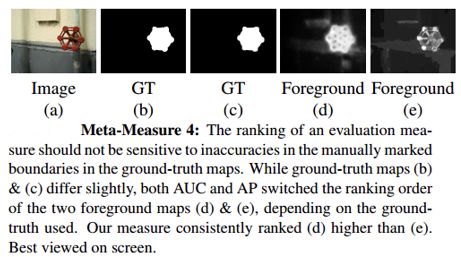
Figure 9
Metametric 5: Manual Sorting
People as high-level primates are good at capturing the structure of objects. Therefore, the sorting results of the evaluation indicators for prospect detection should have a high degree of consistency with the human subjective ranking. We have further proved that the proposed evaluation index is highly consistent with human evaluation (up to 77%) by collecting the ranking results of 45 subjects of different ages, educational backgrounds, genders, and professional backgrounds. Figure 10 below shows the mobile platform that users surveyed.
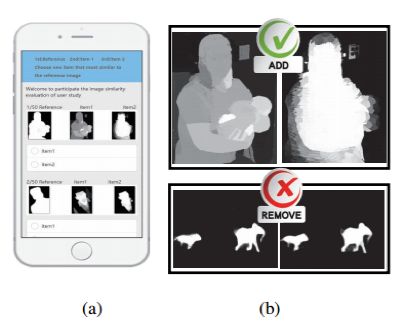
Figure 10
Experimental results
For a fair comparison, the indicator first evaluates four meta-metrics on a publicly available foreground graph inspection data set ASD [3]. The evaluation results show that our results have achieved the best performance:
In addition to benchmarking on the benchmark dataset, extensive tests were conducted on four more challenging datasets with different characteristics to verify the stability and robustness of the indicators.
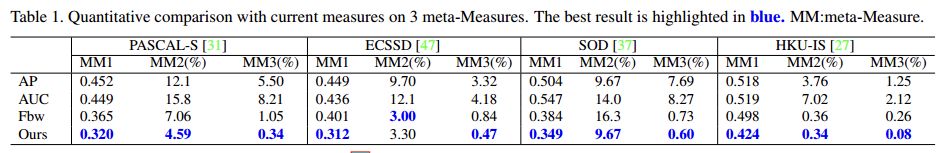
The experimental results show that our indicators have a 67.62%, 44.05%, 17.81%, and 69.23% lower error rate than the second-ranked indicators on the PASCAL, ECSSD, SOD, and HKU-IS datasets, respectively. This clearly shows that the new indicator is more robust and stable.
to sum up
This evaluation indicator will soon appear in the standard Opencv library and Matlab, and can be called directly at that time.
The evaluation index code calculation is simple, only need to add, subtract, multiply and divide the mean value and variance, without the threshold value of 256 times to obtain multiple precision and recall rate, and then draw the complicated interpolation calculation to obtain the AUC curve. Therefore, the S-measure calculation is very small, and it takes only 5.3 ms to measure an image on a single-threaded CPU (4 GHz).
Ring Type Connecting Terminals
Ring Type Connecting Terminals,Terminals,Connecting Terminals
Taixing Longyi Terminals Co.,Ltd. , https://www.longyicopperterminals.com